English Only
GraphDraw: Graph Drawing Program
[Examples]
[Quick Start]
[Download]
[License]
GraphDraw is a graph drawing program. The program draws directed graphs by using a modified version of the spring embedder model[1]. This includes functions for:
- Magnetic Spring Model[2]
- Anchored Map[3]
References
- [1] Peter Eades, A heuristic for graph drawing, Congressus Numerantium, Vol. 42, pp. 149-160, 1984.
- [2] Kozo Sugiyama and Kazuo Misue, Graph Drawing by the Magnetic Spring Model, Journal of Visual Languages and Computing, Vol. 6, No. 3, pp. 217-231, 1995.
[http://dx.doi.org/10.1006/jvlc.1995.1013]
[PDF]
- [3] Kazuo Misue, Anchored Map: Graph Drawing Technique to Support Network Mining, IEICE Trans. Inf. & Syst., Vol. E91-D, No. 11, pp. 2599-2606, 2008.
[IEICE page]
Co-authorship
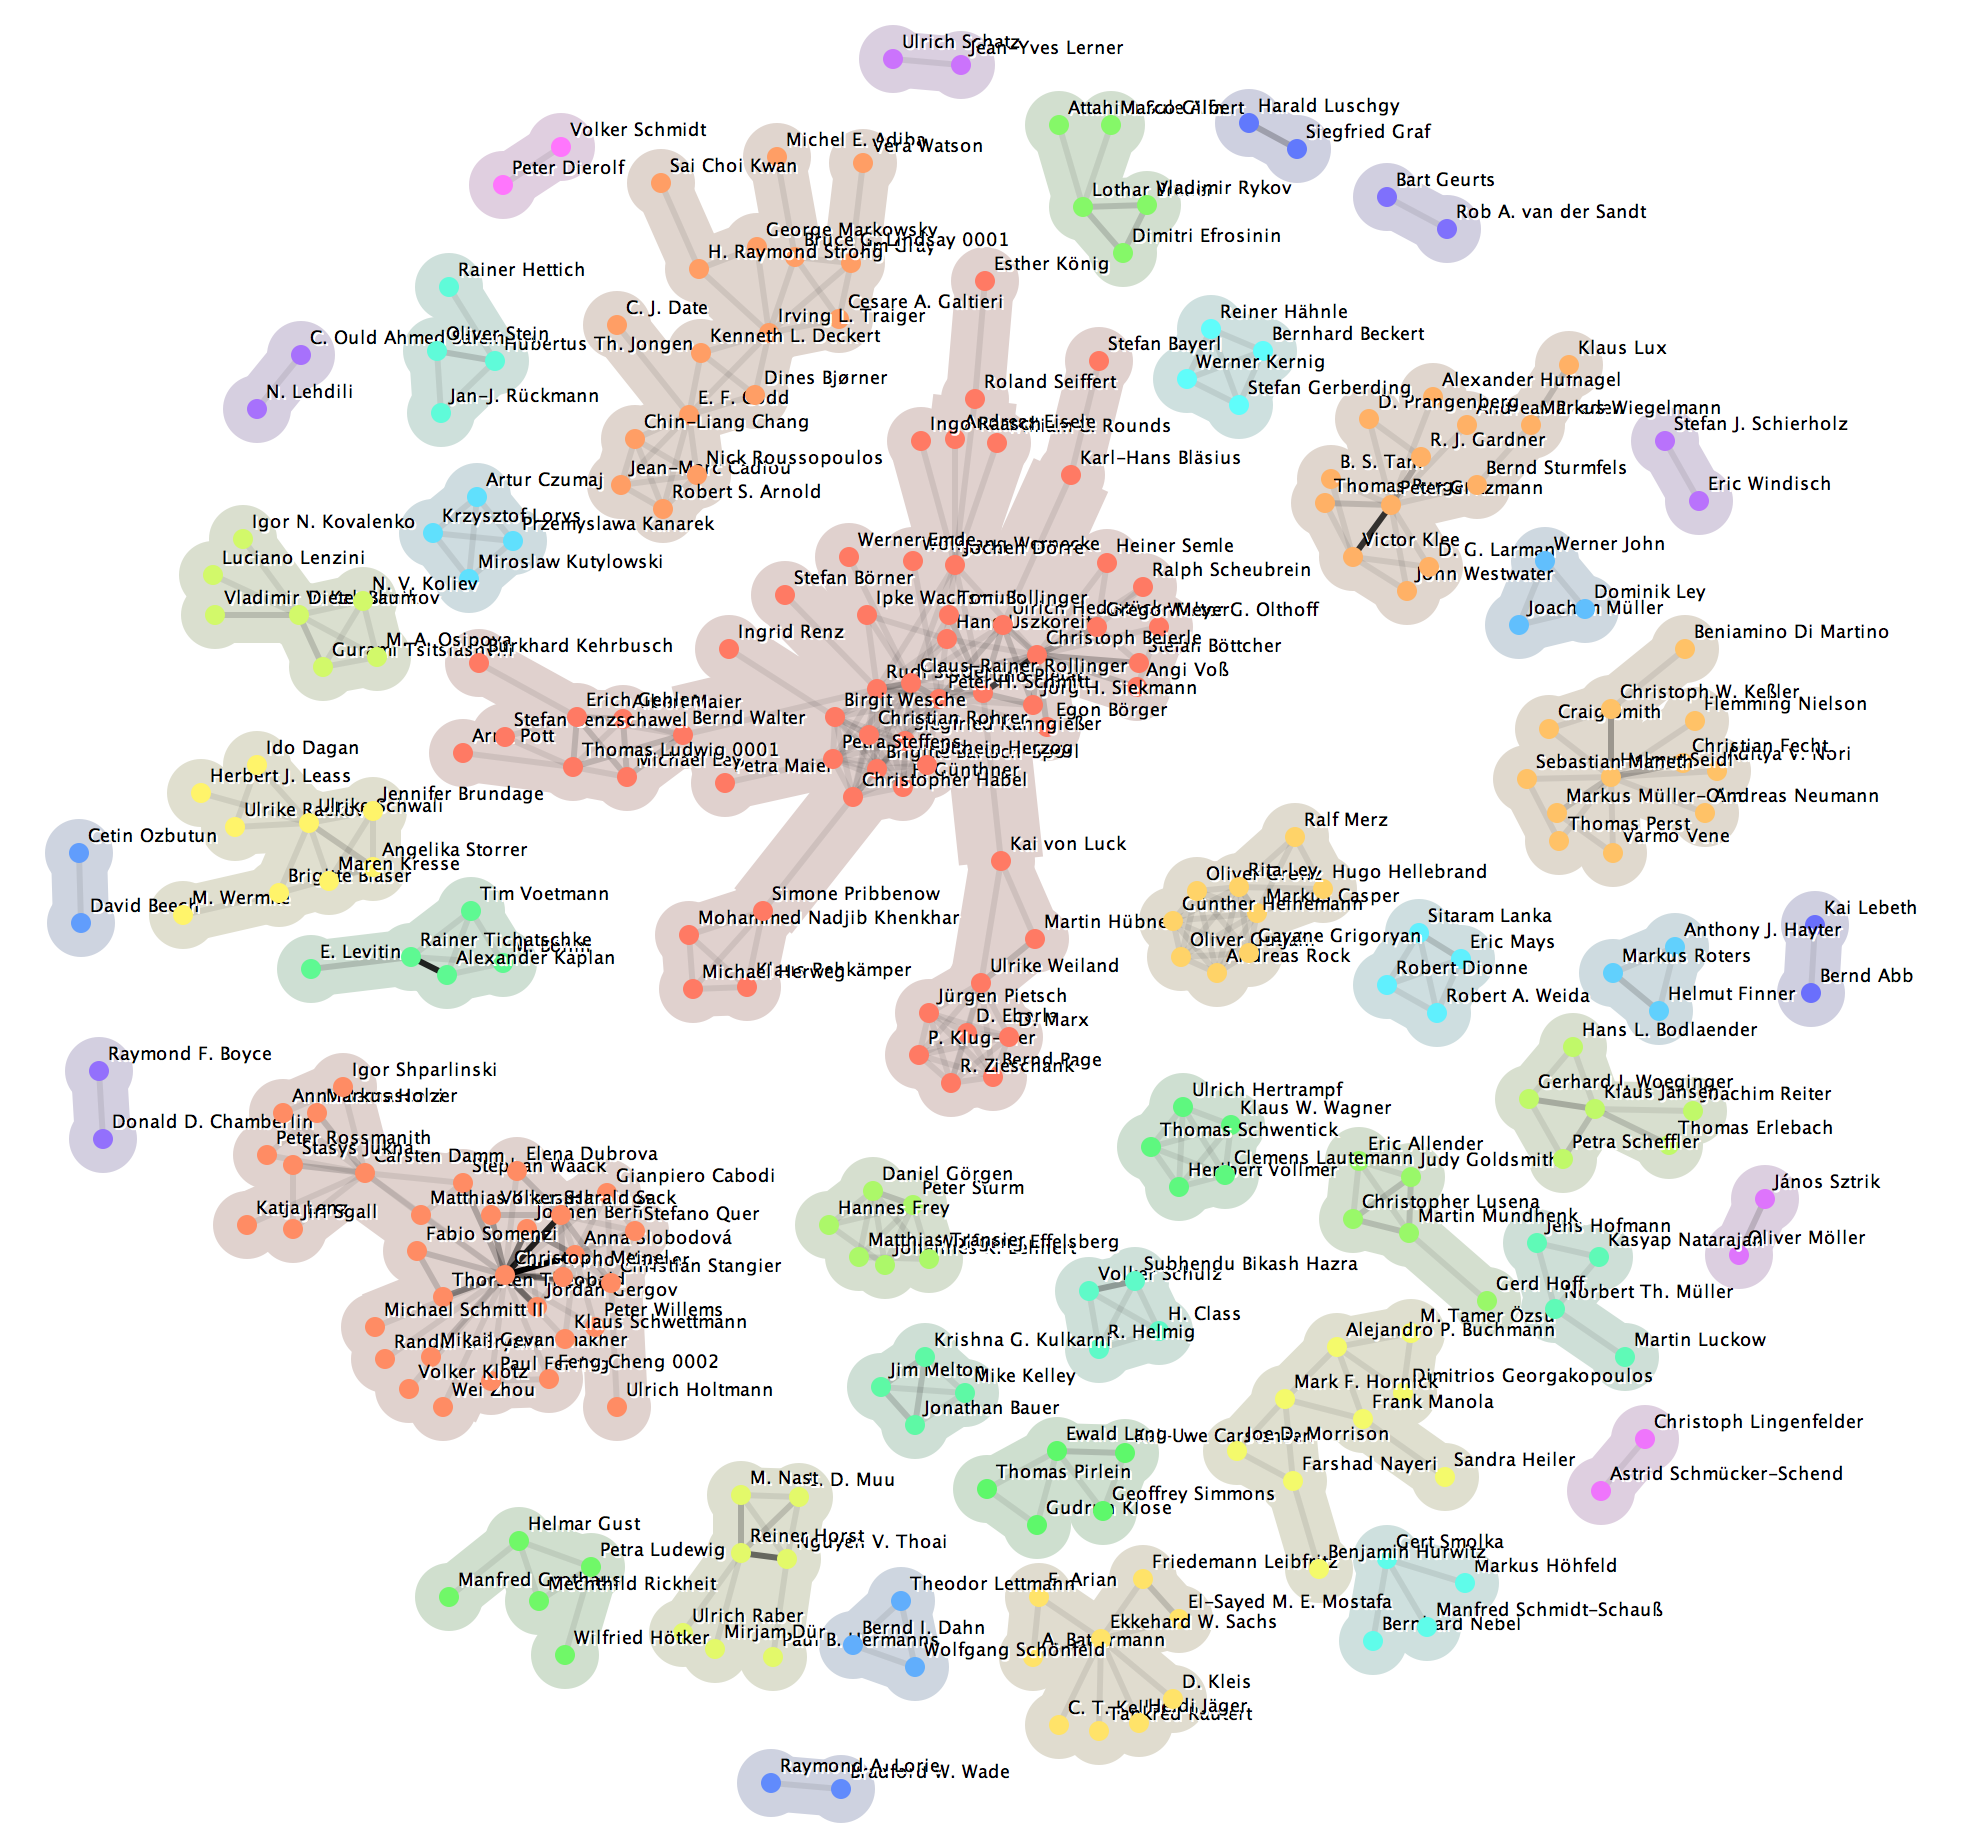
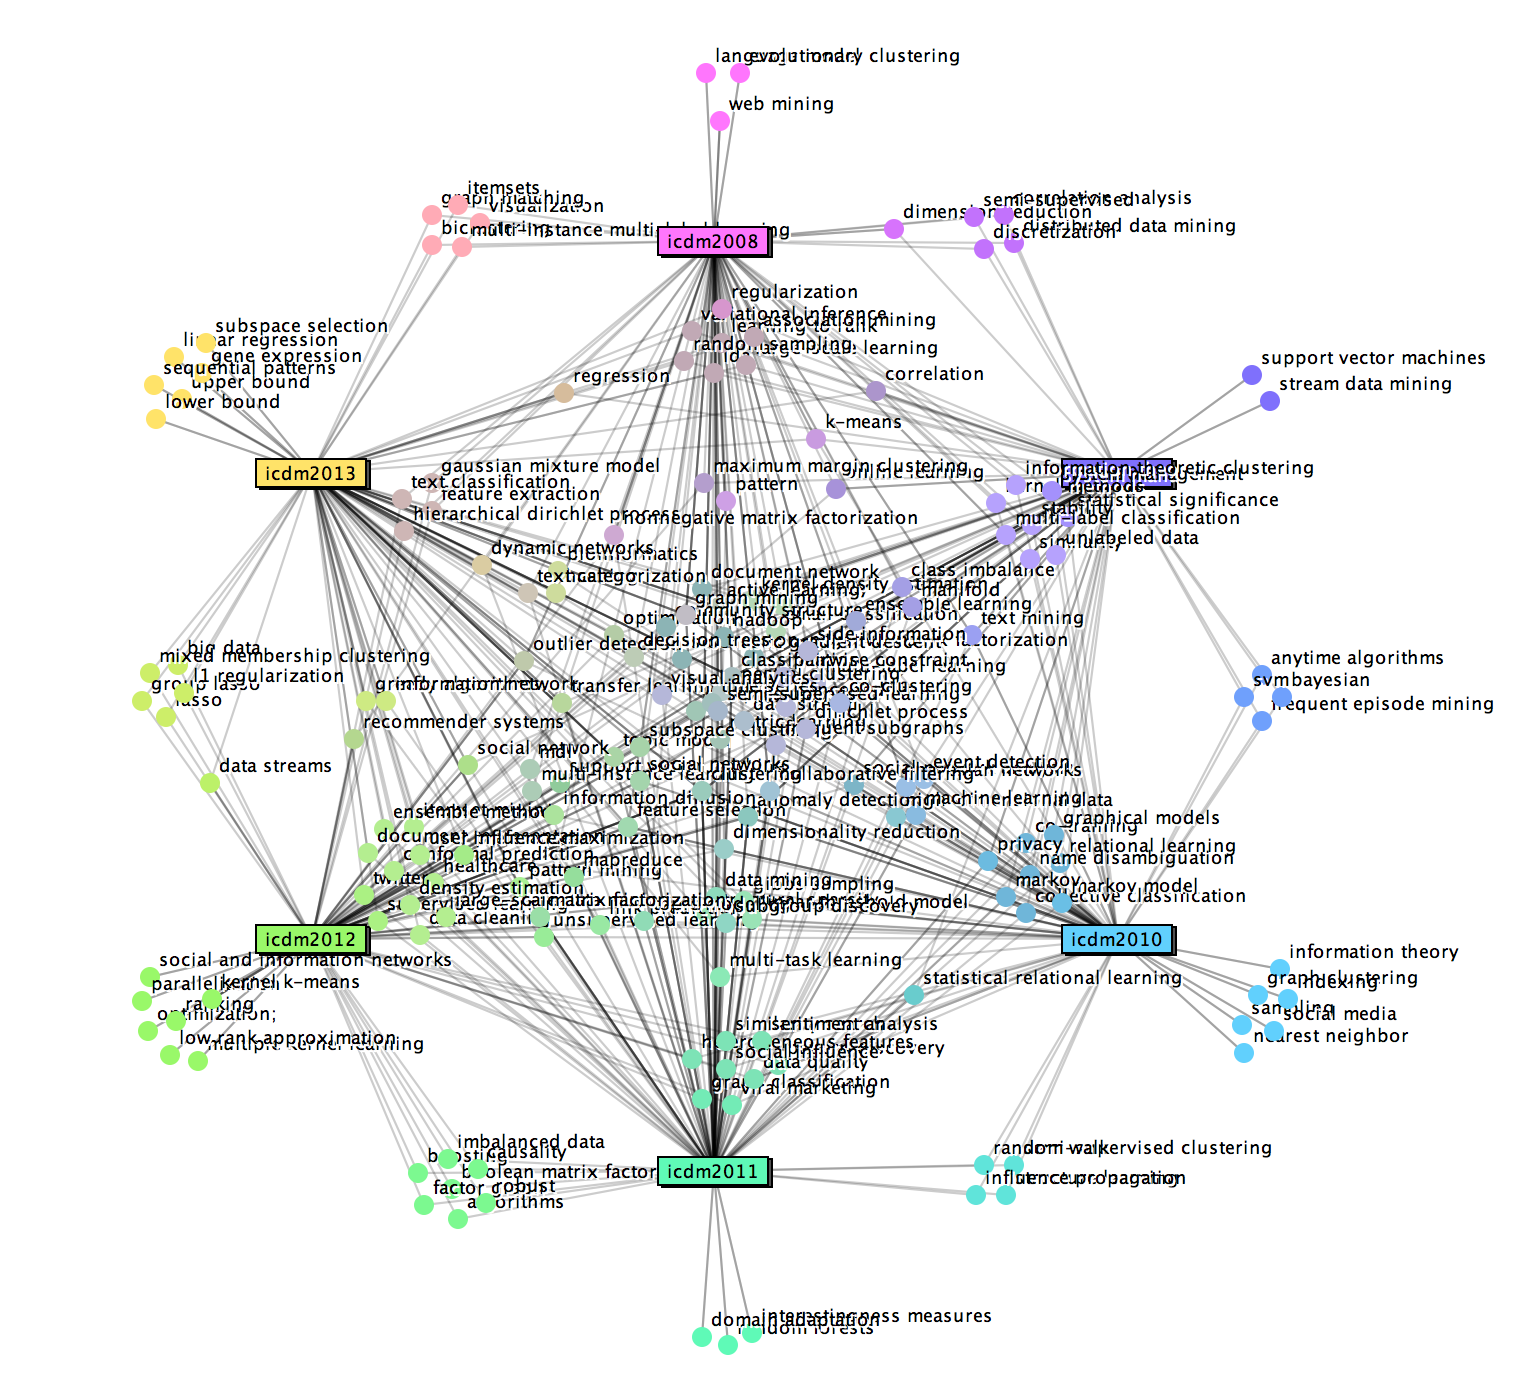
Anchored Map
Data File
Data should be described as a CSV file. Each line of the CSV file expresses an edge and each line consists of three fields: a tail node, a head node, and a weight. One of the easiest way to understand the format is to see a sample data.
Simplest Usage
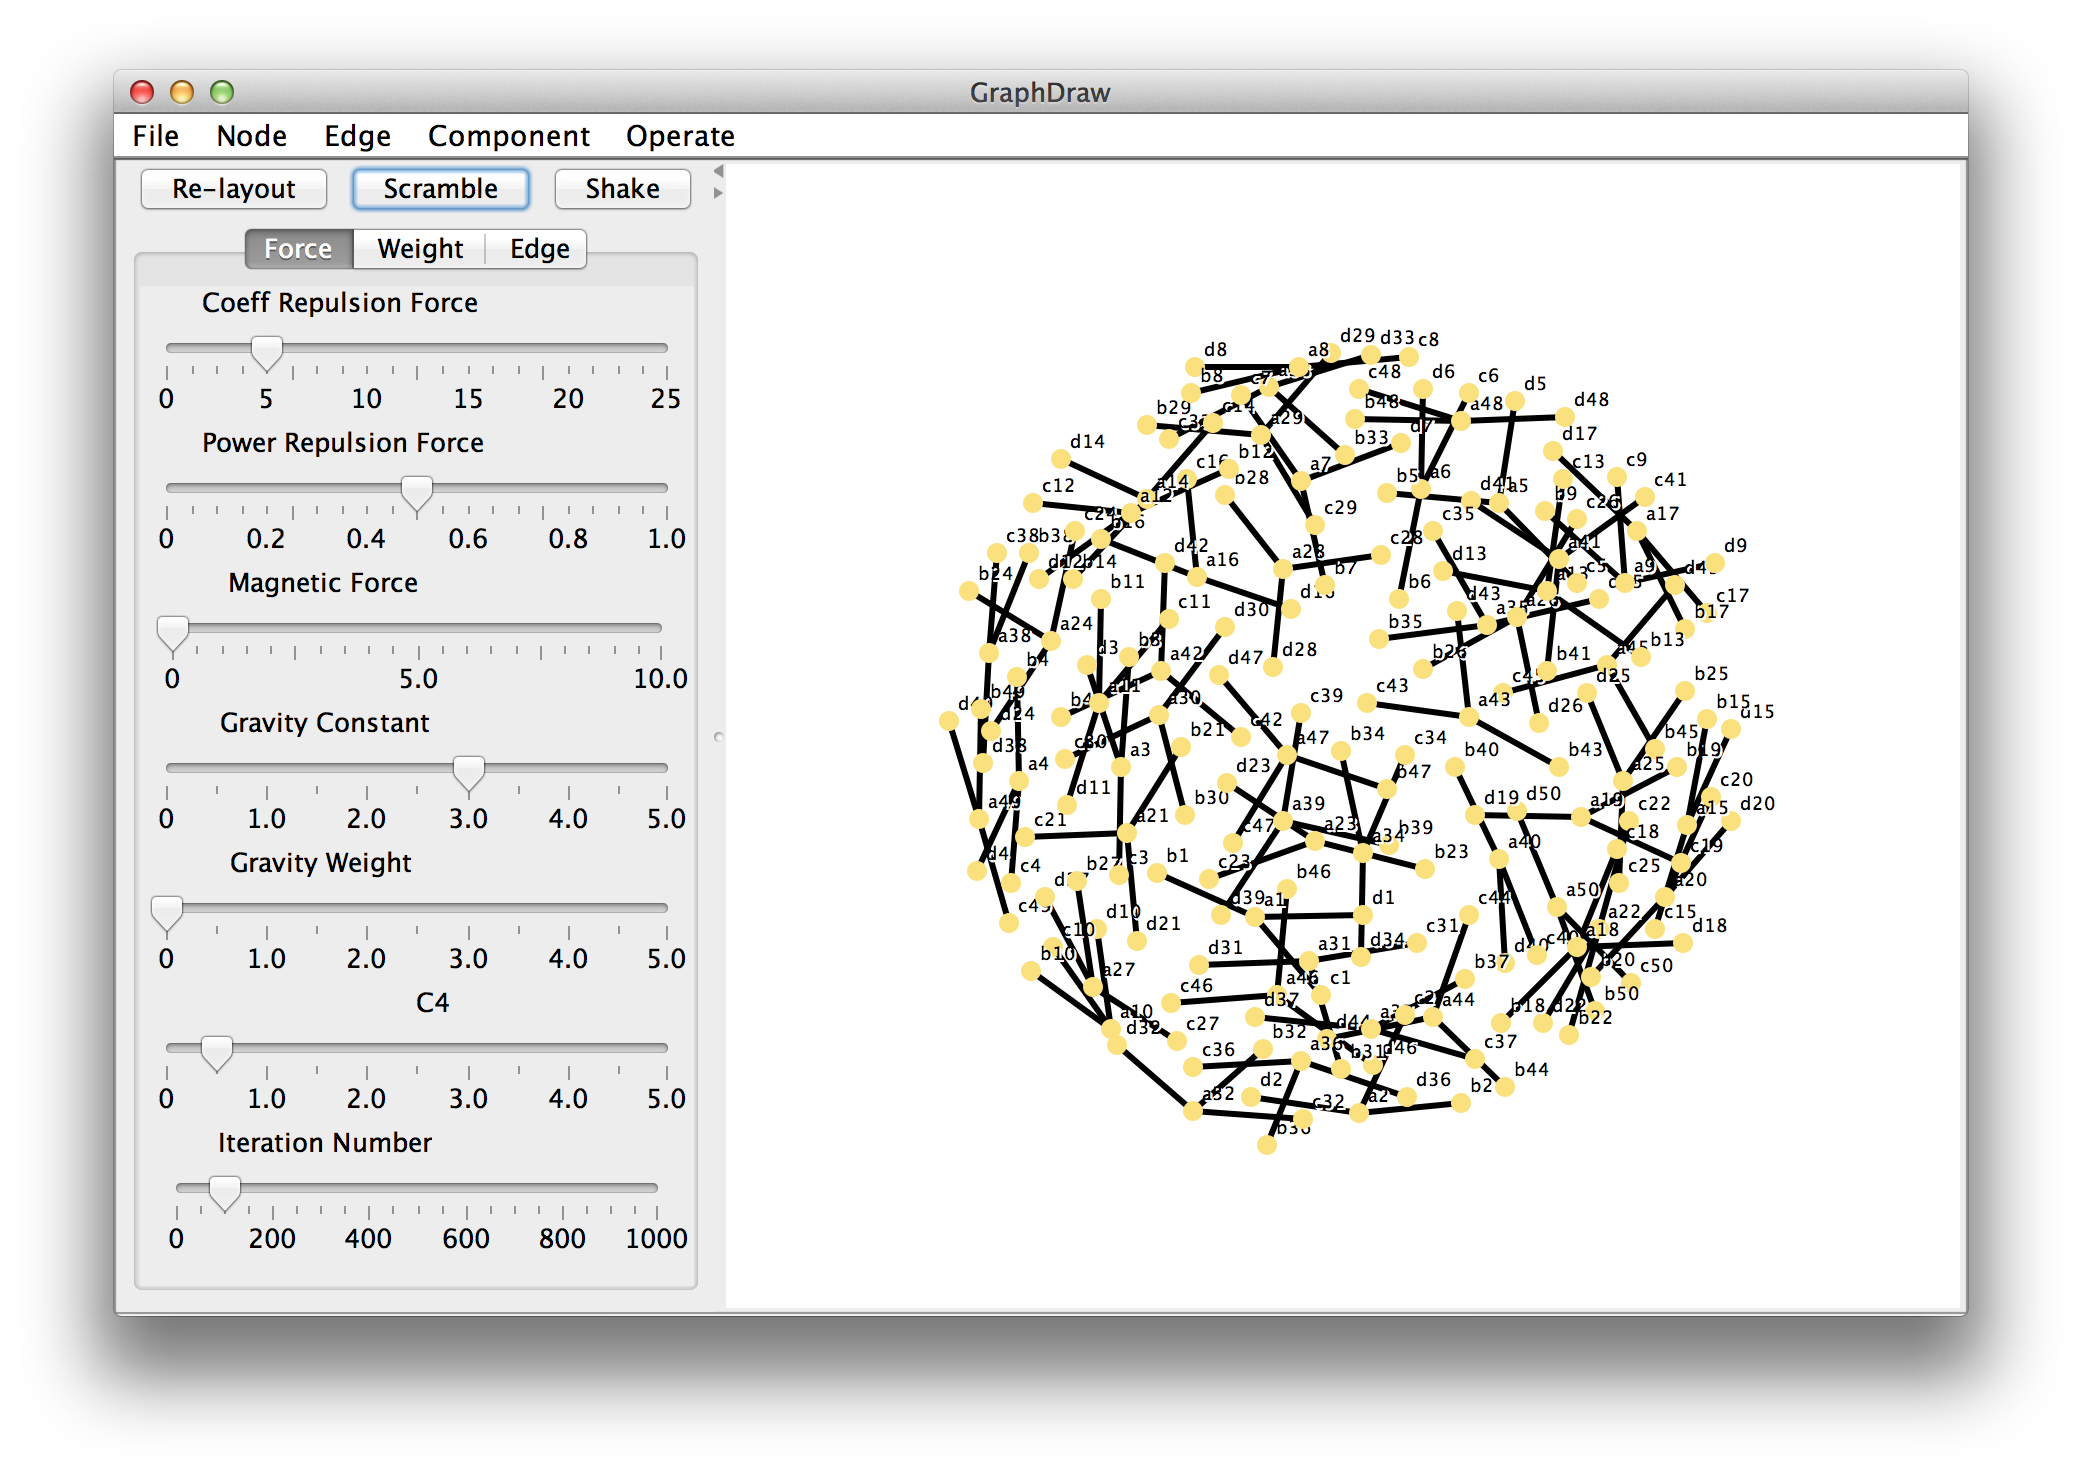
Magnetic Spring Model
- Run the program
- Load a file
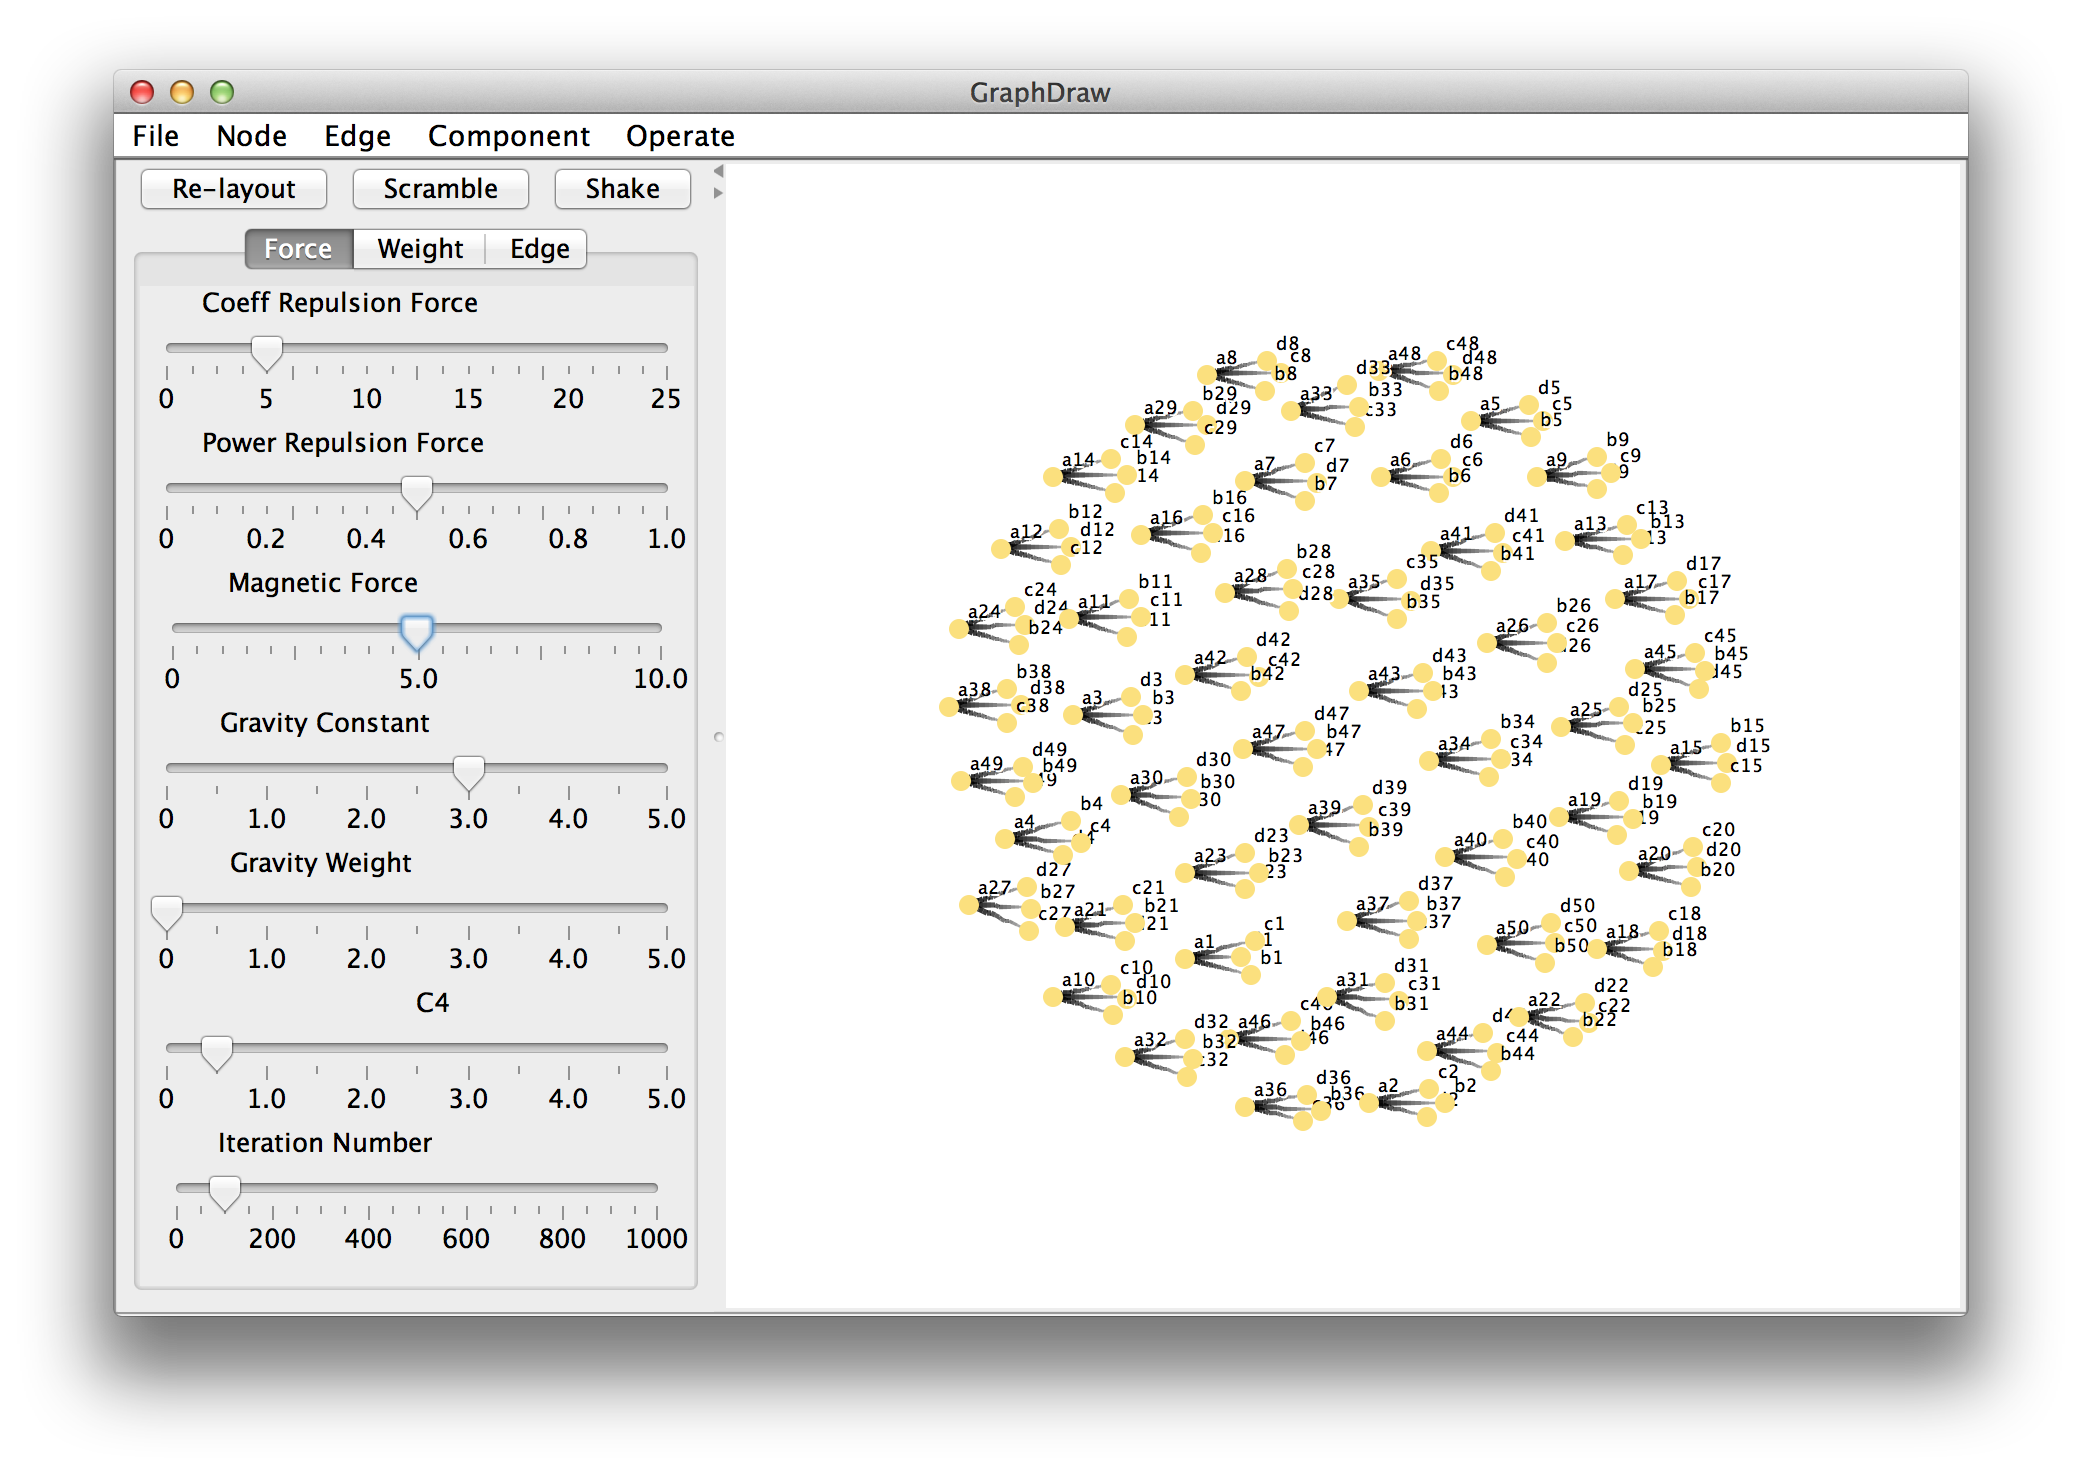
- Change "Magnetic force": Slide knobs as you like. The following screen shot shows the default graph at the magnetic force is 5.0. All edges are heading right hand side. (Tapered and Gradation have been chosen as Edge appearance at the Edge menu.)
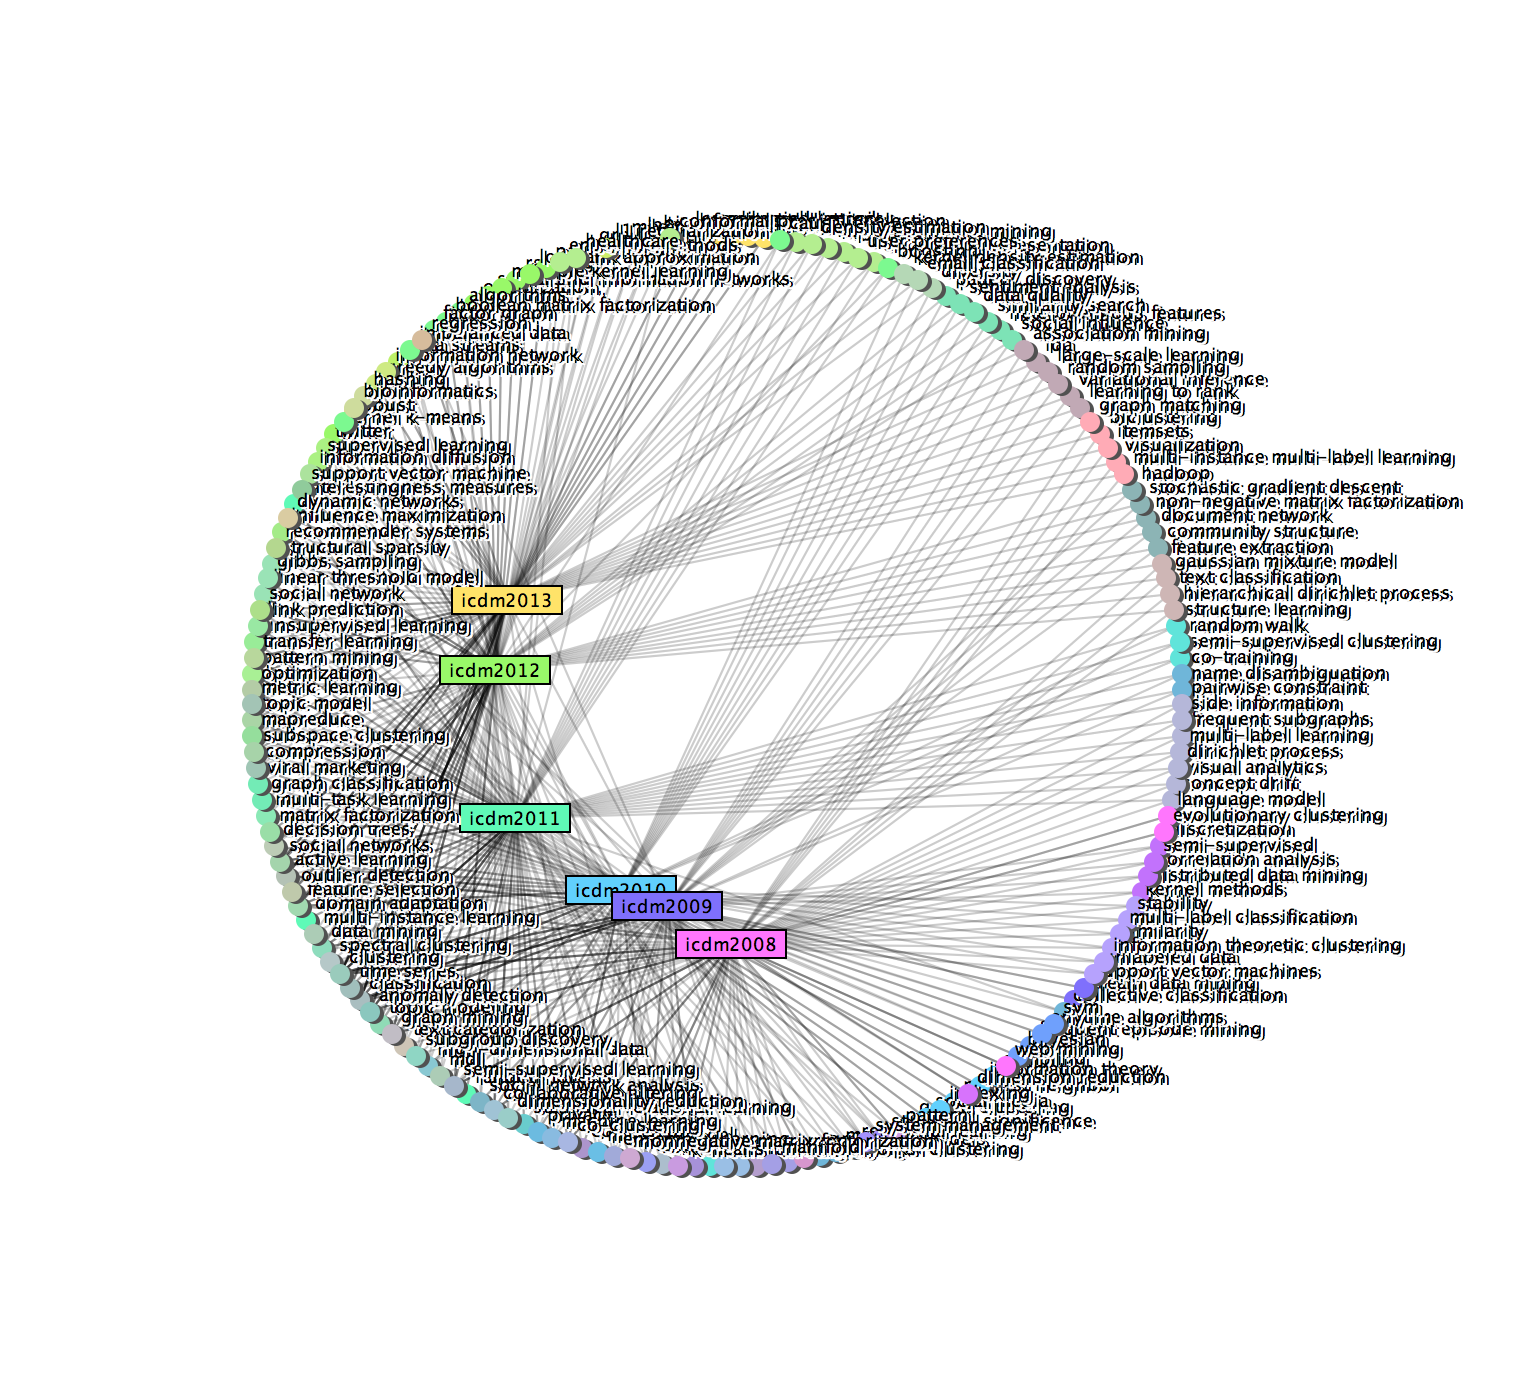
Anchored Map
- Run the program
- Load a file
- Make an Anchored Map: Choose appropriate item form the Operate menu.
- Choose "Fix Tails on a Circumference": tails will be fixed as anchors on a circumference. The order of anchors is determined by the order of the data.
- Choose "Fix Heads on a Circumference": heads will be fixed as anchors on a circumference. The order of anchors is determined by the order of the data.
- Choose "AnchoredMap for Tails": tails will be fixed as anchors on a circumference. A good order of anchors is found according to a penalty function.
- Choose "AnchoredMap for Heads": heads will be fixed as anchors on a circumference. A good order of anchors is found according to a penalty function.
- Change parameters as you like. For example,
- Gravity constant: For an Anchored Map, 0.0 is recommended.
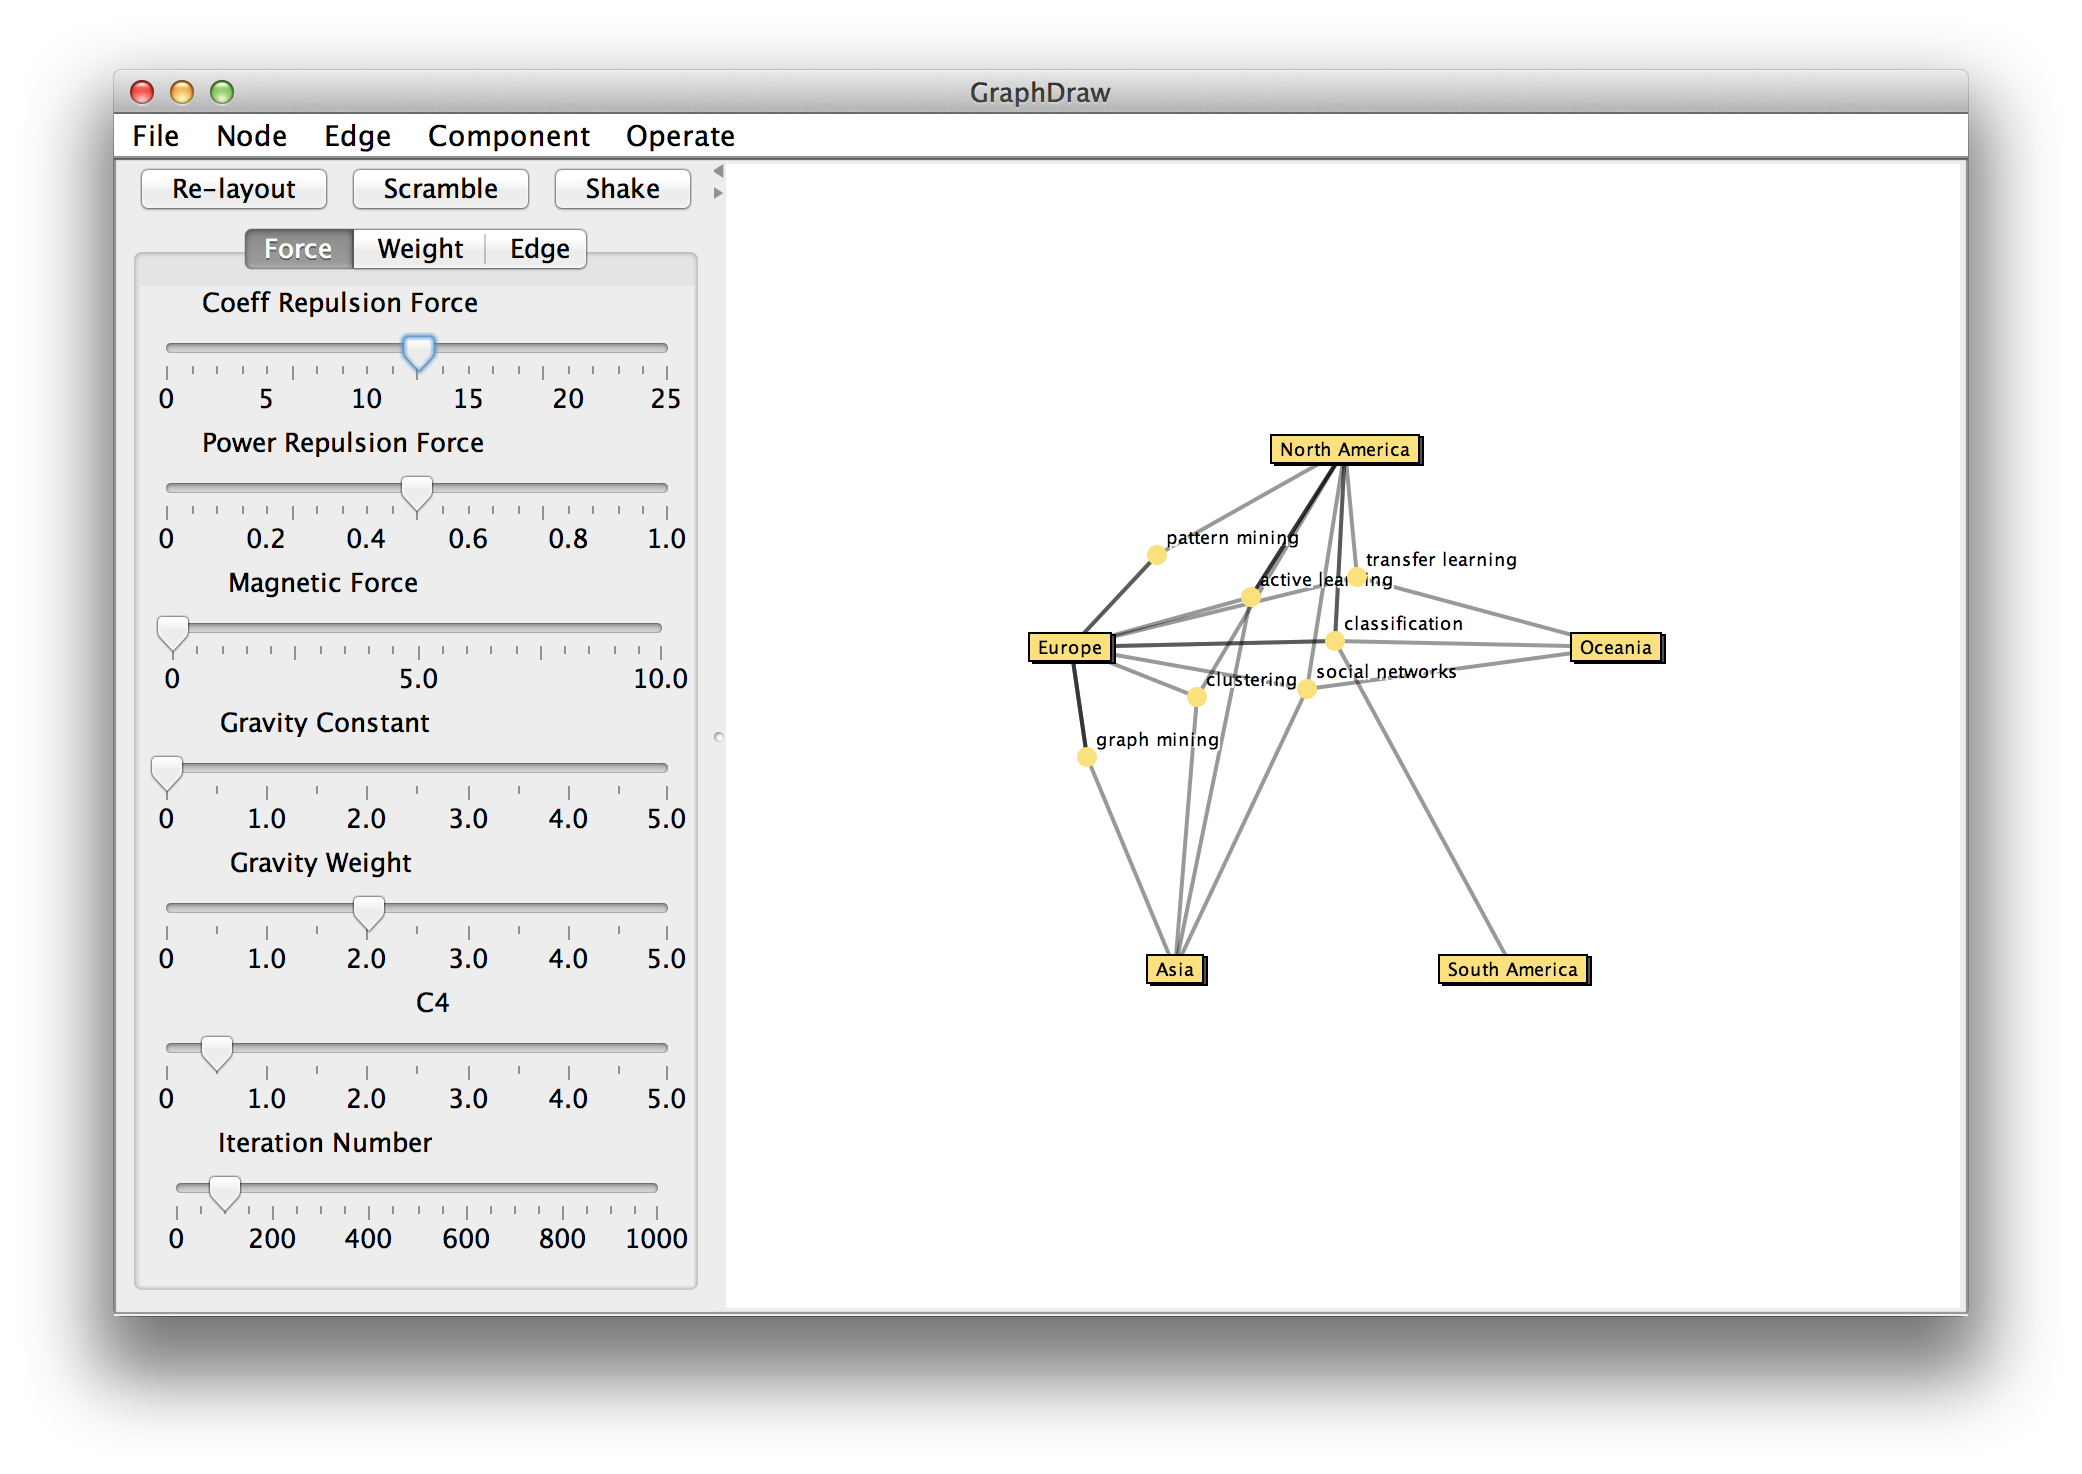
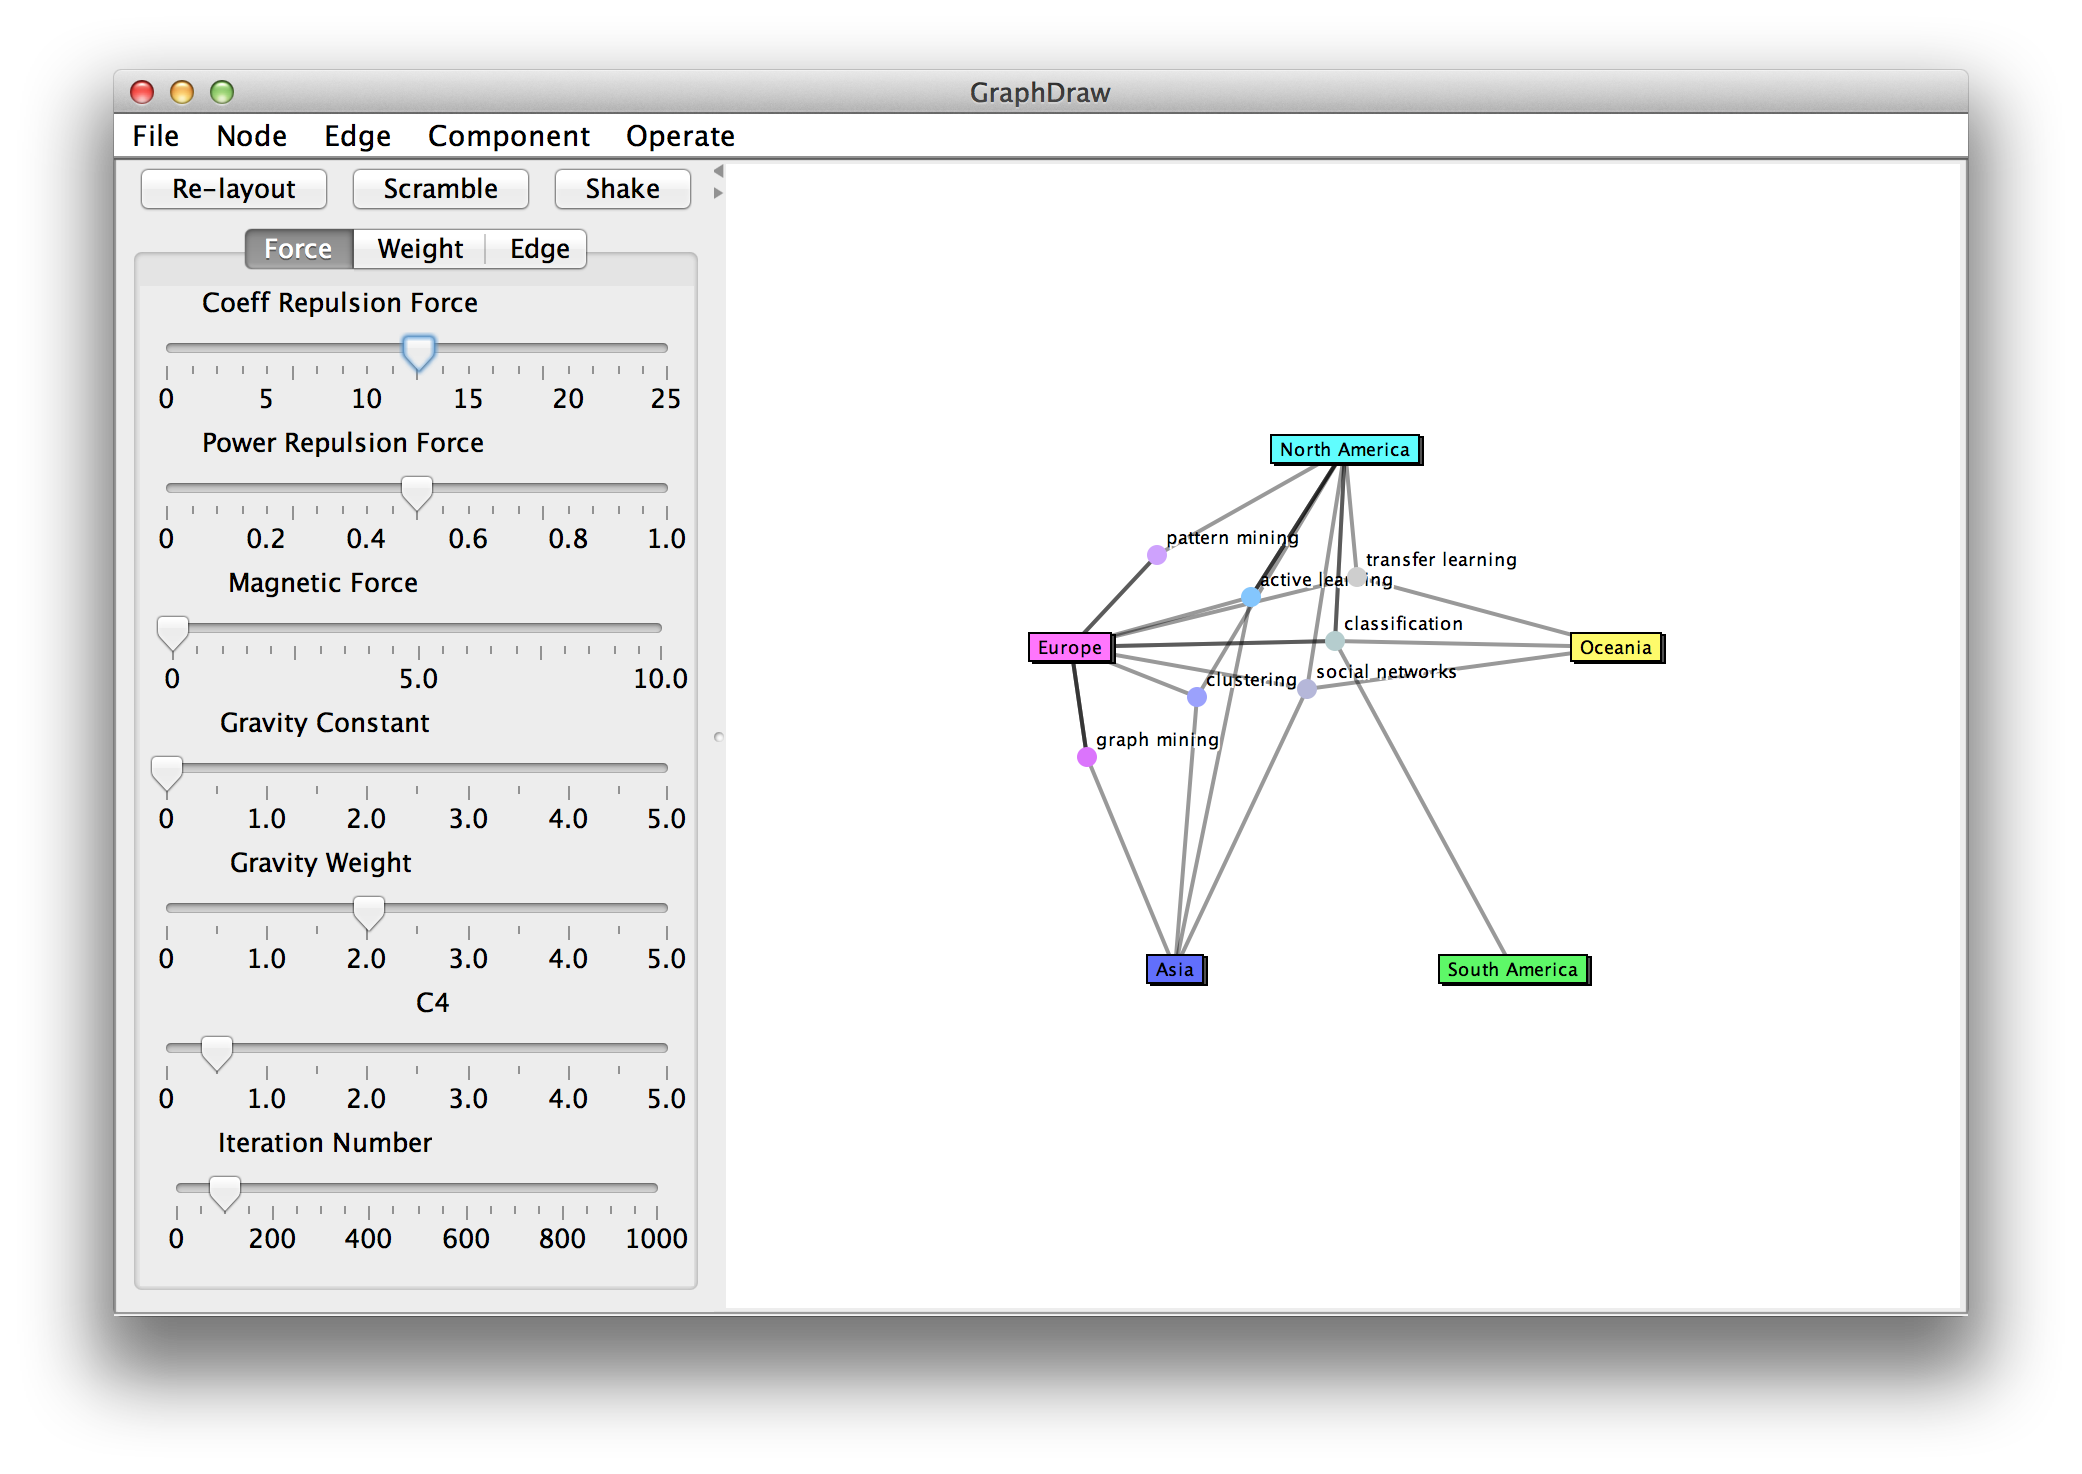
In the following screen shots, a sample data "keywords_country_on_regular_min3.csv" was used. To obtain the diagram, after loading the CSV file, choose "AnchoredMap for Tails". Then, make the Gravity constant to be 0.0. We can assign colors to anchors to make relations among anchors and free-nodes clear. To obtain such diagram, firstly choose "Tails <- Random Colors" from the Node menu, and then, choose "Heads <- Mixed Tails Colors".
 Before downloading program file(s), read the license agreement. Only when you accept the license agreement, you may download the program.
[ACCEPT]
Copyright 2010 Kazuo Misue
Licensed under the Apache License, Version 2.0 (the "License");
you may not use this file except in compliance with the License.
You may obtain a copy of the License at
http://www.apache.org/licenses/LICENSE-2.0
Unless required by applicable law or agreed to in writing, software
distributed under the License is distributed on an "AS IS" BASIS,
WITHOUT WARRANTIES OR CONDITIONS OF ANY KIND, either express or implied.
See the License for the specific language governing permissions and
limitations under the License.
This program includes Scala libraries. For the libraries, please see Scala license.